Graphic Reporting within Second Life
December 28, 2007 · 159 views · 0 comments
Nearby In Time
.jpg) XML-RPC and HTTP Requests
December 28, 2007
XML-RPC and HTTP Requests
December 28, 2007
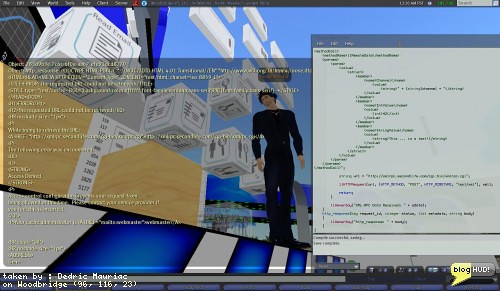 XML-RPC and HTTP Requests
December 28, 2007
XML-RPC and HTTP Requests
December 28, 2007
.jpg) Kumi Kuhr Christmas Party
December 28, 2007
Kumi Kuhr Christmas Party
December 28, 2007
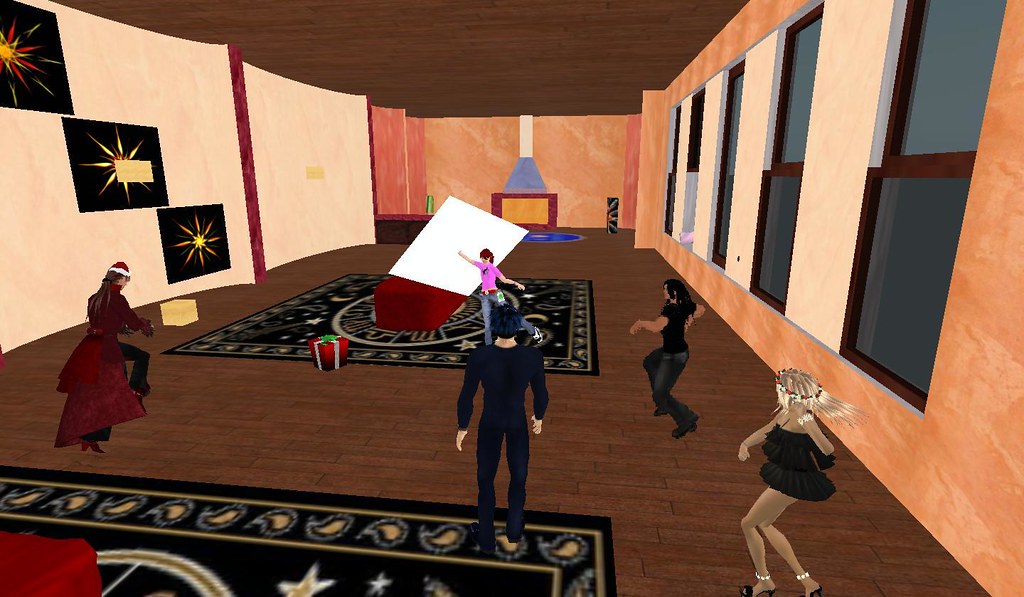 Kumi Kuhr Christmas Party
December 28, 2007
Kumi Kuhr Christmas Party
December 28, 2007
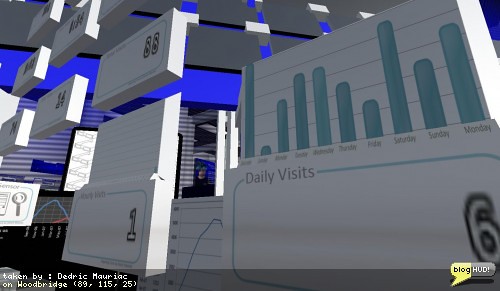
.jpg) Graphic Reporting within Second Life
December 28, 2007
Graphic Reporting within Second Life
December 28, 2007
 Graphic Reporting within Second Life
December 28, 2007
Graphic Reporting within Second Life
December 28, 2007
.jpg) Finding the day of the week
December 29, 2007
Finding the day of the week
December 29, 2007
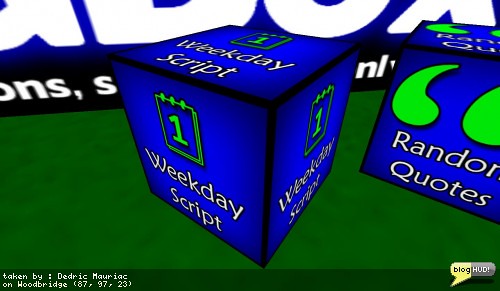 Finding the day of the week
December 29, 2007
Finding the day of the week
December 29, 2007
.jpg) Modeling clothing textures with sculpties
December 29, 2007
Modeling clothing textures with sculpties
December 29, 2007
About
I've been working on creating bar charts in the virtual world of second life. These have got to be the most simple kind of charts to tackle first. I eventually want to go with pie charts and eventually lead up to a 100% stacked area chart. I have my hourly visitor counter bar chart fully working. The others shouldn't be too hard since the groundwork is laid out. I actually find myself comming up with different ideas for reporting. I have 10 reports completed, 3 different sensors, a set of communications between remote locations and another set to cross sim boundaries. I have another box to work on to upload statistics to a website.
Posted by Second Life Resident Dedric Mauriac. Visit Woodbridge.